Each year, SPI delivers the most comprehensive performance benchmark in Professional Services. If you’ve received the 2025 PS Maturity Benchmark™ Report and your Pillar Maturity Overview (no cost to survey contributors), you’re not just informed — you’re equipped.
Here’s how to turn those insights into accelerated performance. Here’s how you level-up!
 What You’re Holding
- 2025 PS Maturity Benchmark™ Report A 265+ page data-rich reference covering KPI trends, maturity scoring, and best practices across SPI’s five Service Performance Pillars™ (at no cost to survey contributors).
- Pillar Maturity Overview A high-level diagnostic showing how your organization scores across SPI’s five pillars — benchmarked against our 2025 dataset (at no cost to survey contributors).
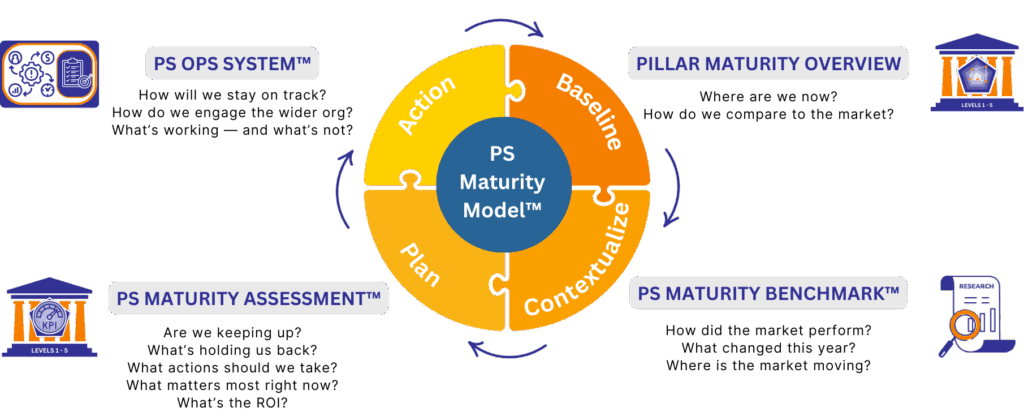
These form two of the key components to the PS Maturity Model™ framework – see below for full framework.
 From Benchmark Insight to Action: What You Can Do
1. Understand Your Maturity Levels
Your scores range from Level 1 to 5 by pillar.
-
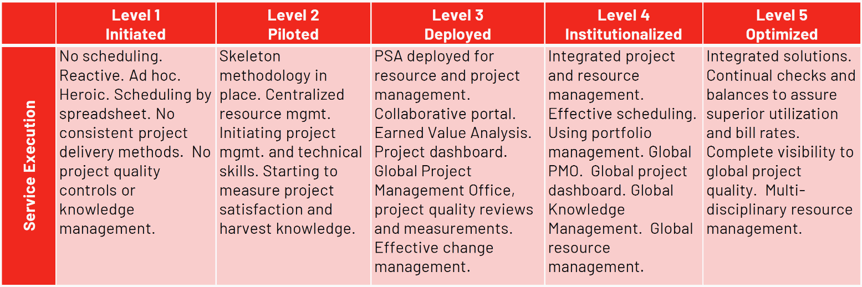
- Level 3? You’re in the “Deployed” zone — structure is in place, but optimization is still needed.
-
- Level 5? You’re in rare company (only ~5% of firms), likely seeing top-tier EBITDA and utilization.
Service Execution Pillar – Example Common Maturity Differences:
Use your Pillar scores to:
-
- Align leadership and investments
-
- Challenge outdated assumptions – or – validate a strategic hunch
-
- Build a roadmap for maturity advancement
-
- Communicate progress across your org
2. Spot Your Strengths — and Gaps
The five pillars are interconnected. Gaps in one (e.g., Talent) hold back KPIs across other Pillars (e.g., in Service Execution with On-time Delivery).
Pro tip: Start with your lowest-scoring pillar. SPI calls this “Getting the Red Out” — where improvement on the lowest performing pillars (especially the Red Level 1s) delivers the fastest and easiest ROI across the whole business.
3. Track the Metrics That Matter
The benchmark includes 165+ KPIs. Not sure where to begin? Start with your preferred six. Here’s some of our go-to metrics:
-
- Billable Utilization
-
- On-time Delivery
-
- Revenue per Consultant
-
- EBITDA %
-
- Project Margin
- Deal Pipeline vs. Quarterly Forecast
Compare your numbers against benchmark norms to set targets, track improvement, and focus performance reviews.
Pro Tip: The Benchmark has a definitions section at the appendix for KPIs and key terms.
 How Maturity Levels Are Calculated
Each pillar score is based on all 165+ KPIs, weighted by their maturity signal and outcome correlation. After 18 years of SPI research, this model reflects what truly drives performance — and what separates average from high performers.
How it works:
- Benchmarking: You’re scored against current-year peer data – the scoring is self-submitted by you during our publicly accessible survey window each Fall.
-
- Weighting: Each KPI has a correlative weighting toward every pillar – designating its data-backed impact on each pillar
- Scoring: Results roll up into pillar maturity levels (1–5), and a total out of 25
How can Leadership be Level 5, if the talent is leaving in droves and revenue growth is far below peers? Our model cuts through subjectivity to identify true pillar performance.
 Context changes how we view performance.
Take Golf. Last year, you shot par on 18 holes and won. This year, you shot the same — par on 18 — and finished 20th. That’s maturity: it’s not just about your score, but how your performance stacks up against the field.
 How to Use the Benchmark Like a Pro
 Strategy & Planning Use the five-year trends and annual summaries to provide some data to back up or challenge those strategic hunches. Model the impact of moving from Level 3 to 4. (Example: Level 4 firms grew revenue at 13.7% vs. 8.9% at Level 3.)
QBRs & Exec Reviews Bring pillar scores into offsites and team meetings. Assign pillar owners to drive maturity advancement. Use maturity scores and KPI deltas to frame your quarterly discussions. Have your leaders come to the table with their own exec summary of their pillar.
Change Initiatives Let the benchmark guide you. Low score in Client Relationships? Review our maturity tables and determine what may be causing it. Talent underperforming? Check the Talent chapter and understand where your gaps are.
Pro tip: Distribute the report to your leadership team and ask them to do 3 things: Identify 1 insight that validates existing strategy; 1 insight that challenges something in your operating model; and 1 insight that has you concerned about the market.
 Find What Matters Faster (Ctrl+F)
The report is a deep-dive of insights — but you can cut straight to the insights you want.
Pick your industry. Pick your pillar. Pick your region. Pick your company size. Then Ctrl+F your way through. You’ll find the KPIs, trends, and insights that match your exact slice of the market — fast.
Example searches:
-
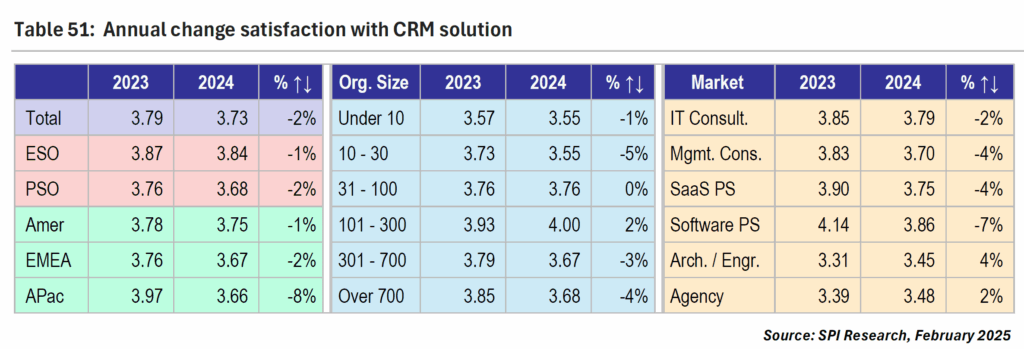
- Ctrl+F: “IT Consult.”, “EMEA”, “31 – 100”
- Command+F for the Mac users amongst us…
Pro tip: On the Contents page – holding CRTL+ clicking on the relevant heading title will take you to that page. Command+ for the Mac users…
 What Critical Questions does the PS Maturity Model Help Answer?
 Want a Deeper Diagnostic? Take the PS Maturity Assessment™
If the benchmark shows how you compare, the PS Maturity Assessment™ shows what to do next — and why it matters.
It’s not just a score. It’s your roadmap to high maturity, and accelerated performance. Move what matters!
What You’ll Get:
-
 Scoring across all 165+ KPIs within our five pillars
-
 Comparison vs. peers, top performers, and market average
-
 Custom KPI prioritization based on highest impact potential
-
- Forecasted ROI and performance trajectory
-
 Action plan linked to your firm’s maturity gaps
-
- A copy of the latest PS Maturity Benchmark Report
 Multiple Leadership Q&As with an SPI Analyst
Firms that take the assessment don’t just improve — they focus. The result: measurable gains in revenue, profitability, and utilization.

 Final Thought: Maturity Is a Management System
Maturity isn’t just a diagnostic — it’s your operating model for continuous performance improvement.
It helps you lead better, execute smarter, and align every function to what matters most.
If you’re unsure where to begin, get in touch and we’ll help advise: info@spiresearch.com
About SPI:
Since 2006, Service Performance Insight (SPI) has been the leading authority on performance optimization for professional services organizations. As the creator of the Professional Services Maturity Model™ (PSMM), SPI provides proven frameworks, benchmarking data, and actionable insights to drive EBITDA, productivity, and scalable growth.
Our research spans five critical pillars of service performance—leadership, talent, client relationships, service execution, and finance & operations—and has helped over 50,000 organizations navigate change and scale with confidence.
At the core of this approach is the PS Maturity Assessment™: a data-backed roadmap for leadership teams to understand what’s working, uncover performance gaps, and accelerate improvement—benchmarked against industry peers and high performers.